Trading Psychology & Execution · Entry 70 of 71
Gold Spot Chart Analysis
Real-world study of Gold Spot / U.S. Dollar 30m chart
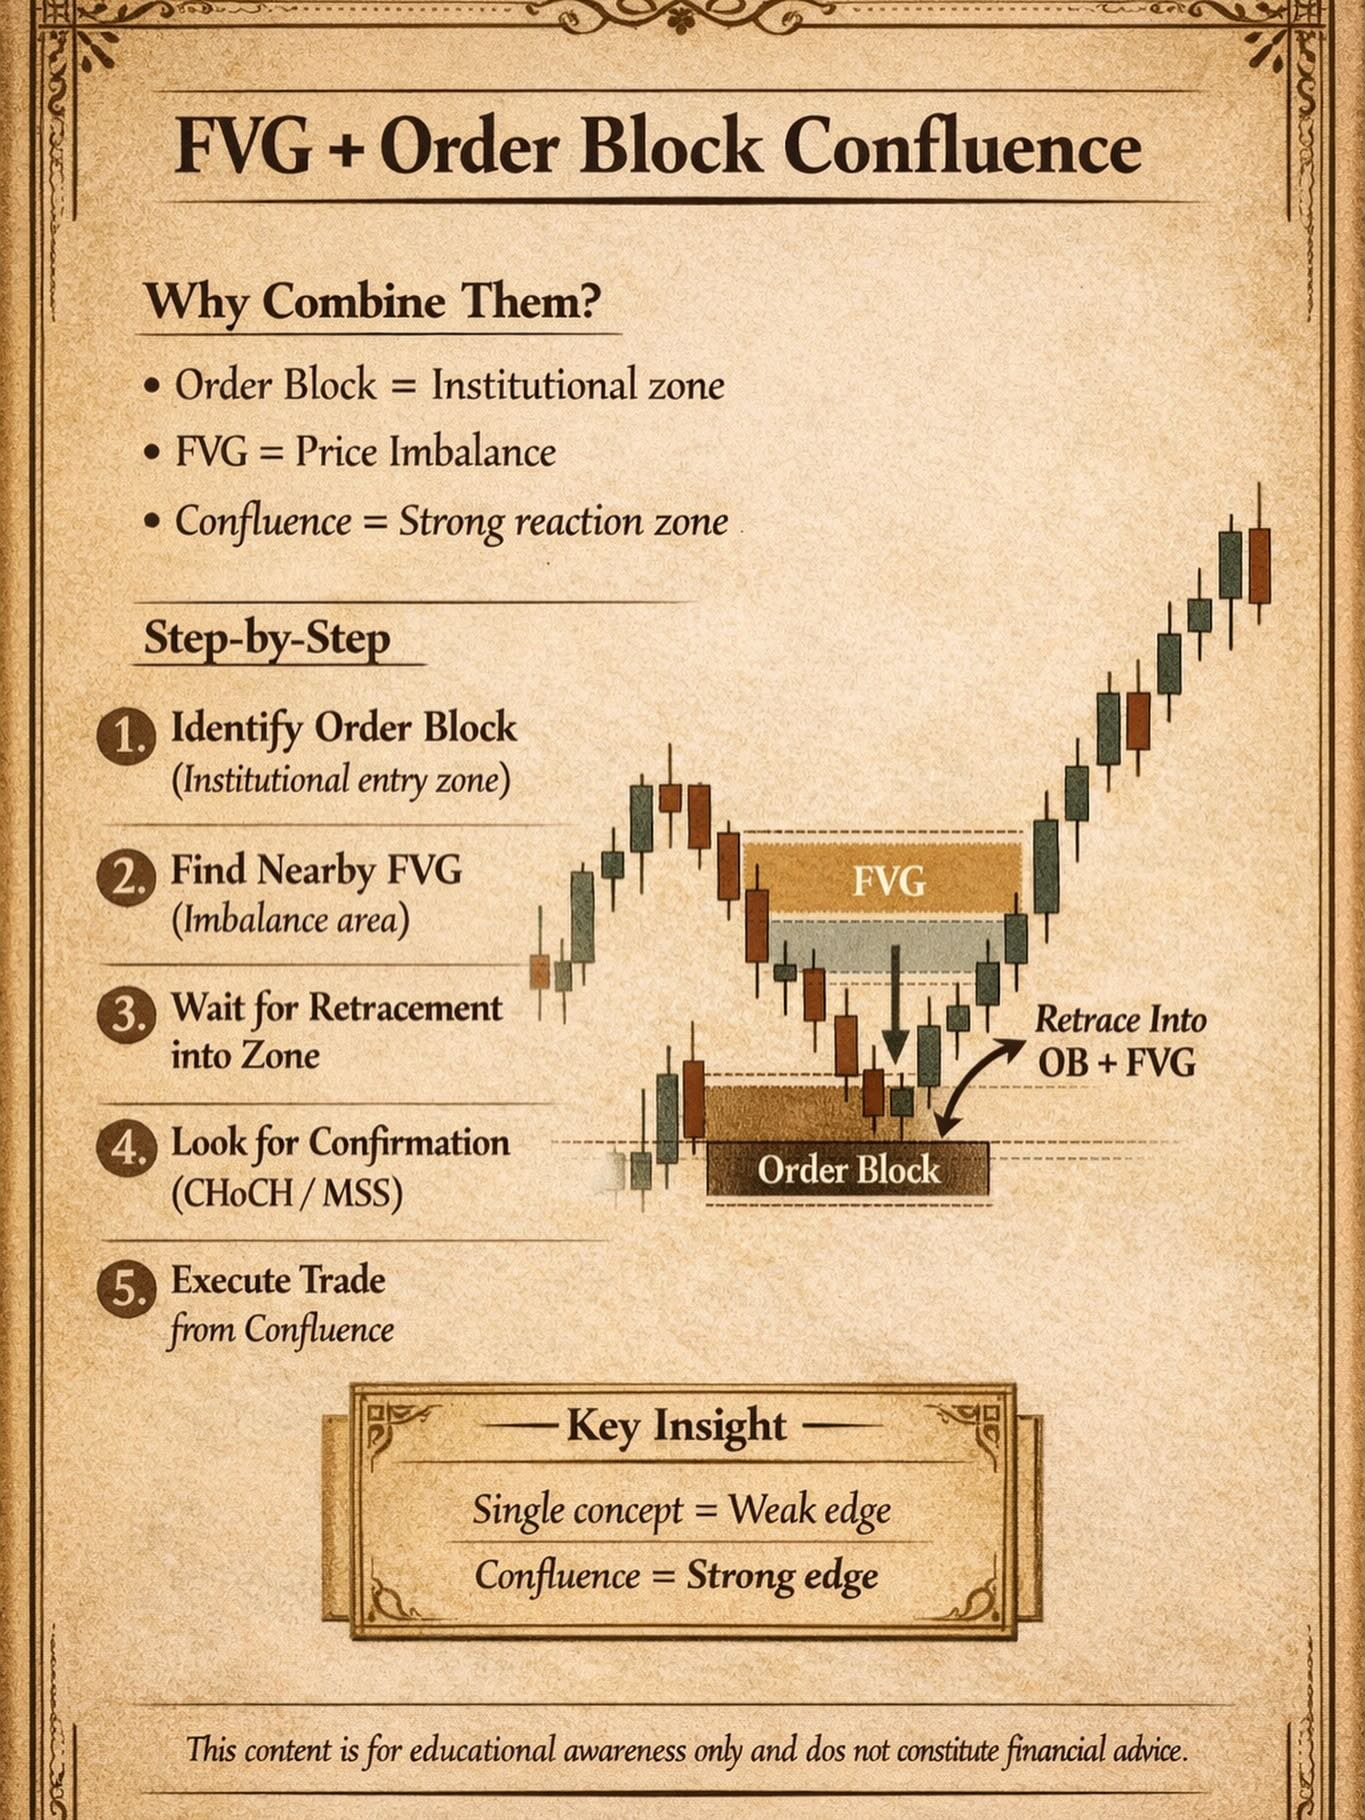
Technical Breakdown
This chart showcases the live price action of Gold Spot (XAU/USD) on a 30-minute timeframe from OANDA.
- Trend Observations: The chart shows the transition of price through expansion and retracement cycles, highlighting moving average lines acting as dynamic support/resistance.
- Key Levels: Key price targets near 5,108.255 represent critical premium and discount swing boundaries where institutions hunt liquidity.
- Volume Analysis: Significant volume surges (5.97K) accompany the displacement phases, confirming institutional participation.